Large Sample Hypothesis Testing
When you have a large sample, say n > 50, it becomes
time consuming to look up huge tables. When ![]() and
and ![]() you can use the standard normal
distribution to approximate the binomial distribution. (‘n’ being
the number of items in the sample, ‘s’ being the probability of success, and ‘f’
the probability of failure). Here’s an example of how to do this:
you can use the standard normal
distribution to approximate the binomial distribution. (‘n’ being
the number of items in the sample, ‘s’ being the probability of success, and ‘f’
the probability of failure). Here’s an example of how to do this:
|
Sponsored Links |
|
Of the students in a school, 30% wear glasses. A sample of 100 students is taken, and of the 100, 45 wear glasses. Does this sample of students have a higher number of students with vision problems than the whole school community? |
|
Solution |
|
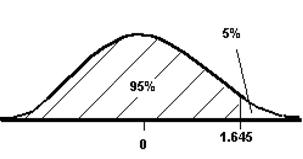
First of all decide on a level of significance – 5% is usually the standard. We also need to decide the hypotheses: Null hypothesis, H0 The sample has the same percentage of vision impaired students as the school Alternative hypothesis, H1 The sample has a higher number of students with vision problems than the school Note that this is known as a one-sided hypothesis testing question – we’re only interested in testing whether the sample has a higher number of vision impaired students than the school as a whole. s = 0.3 f = 0.7 Note ‘s’ and ‘f’ are calculated from the already existing statistical data – that 30% of the students in the school wear glasses. In other words, the success and failure probabilities are taken from the population data, not the actual sample. Check whether the normal approximation can be used: Both checks are larger than 5, so we can use a normal distribution to approximate the binomial distribution. We are using a significance level of 5% – so we look up the normal distribution tables to find out how many standard deviations away from the average this represents. When you look up the table, you should find that a 5% significance level corresponds to 1.645 standard deviations. Notice how the 5% area is only on one side of the probability distribution – this corresponds to the fact this is a one-sided test – we are only interested whether the sample has a higher percentage of vision impaired students than the school as a whole. If our sample was a perfect representation, 30 students from it would wear glasses. But 45 do. We need to check whether 45 out of 100 is within 1.645 standard deviations of 30 out of 100. If it is, then the sample is consistent. First we have to find out how many students a standard deviation is: To calculate how many standard deviations 45 is from 30: This is more than the allowable 1.645 standard deviations, so the sample is not consistent with the school population. |