Products that are sold in very large quantities and mass produced are big money for companies. For instance, millions of computer chips are sold every year in new computers. I’m writing this on a brand new LCD computer monitor for instance, of which millions would be sold every year.
Now, the companies could spend lots and lots of money, and produce super high quality products that are perfect and never fail. But this would mean that the cost of the product for the consumer would be very high, and not many people would buy them. Alternatively, a company could spend very little money on quality control, and sell lots of very cheap, but shoddy products. However, even though they might at first sell a lot of them, once the word got out that they were unreliable, no-one else would buy them, and they’d also get a lot of products returned for refunds.
Sponsored Links
So what do companies do – they pick the optimum point which produces the cheapest possible product whilst keeping the number of faulty products to a minimum.
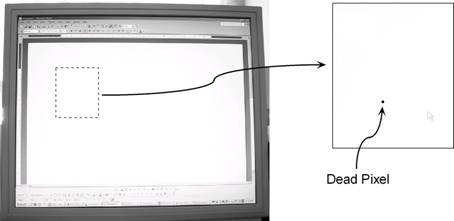
Take LCD monitors for instance. ‘Dead’ pixels are pixels that are constantly black regardless of what the colour on the screen is. This can be annoying, especially when you’re doing something like word processing, and you have a white background. The black dot shows up pretty clearly on the screen:
A typical 17 inch monitor at the time of writing has a resolution of 1280 by 1024 pixels. Each pixel has three transistors, one each for red, green and blue. This means there are 3,932,160 transistors. Quality control for this sort of thing can be a nightmare. Say you have a 0.001% chance during manufacture of a transistor being faulty. Sounds pretty good hey? However, this works out to 39 faulty transistors, which could mean 39 dead pixels!
Without spending a lot of money and making the product really expensive, the companies are going to churn out the occasional monitor with dead pixels on it. Some people don’t care, but others will return the product and either demand a replacement or refund.
|
Bob’s computer factory makes LCD monitors. They sell directly to the public. Bob sells each monitor for $400. If he spends $400 manufacturing the monitor, he can produce a monitor which has absolutely no dead pixels. However, he wouldn’t make any profit. If he spends less than $400 manufacturing it, he starts to increase the probability of dead pixels. The chance of producing a dead pixel free monitor is: When a customer receives a monitor with dead pixels on it, there is a 50% chance they will care enough to return it. Dead pixels are very hard to fix so Bob just throws the monitor out, which means he loses the entire cost of producing the monitor. How much money should Bob spend producing each monitor for the maximum profit per monitor? |
|
Solution |
|
We can do this question by working out how the expected profit per monitor depends on how much Bob spends on the manufacture. The expected profit is going to be the sell price, minus the production price, minus the chance that it is returned times the sell price. It represents the average profit Bob will get per monitor sold. The probability of the monitor being returned depends on two things – the probability that the monitor has dead pixels on it, and the probability that a customer will care enough to return it: We know the probability of a monitor with dead pixels being returned – it’s 50%, or 0.5. The probability of there being a dead pixel is dependent on how much Bob spends producing the monitor. We know that the probability that there are not any dead pixels is just this: Now, having no dead pixels and having dead pixels are mutually exclusive events, so: We can put this into our probability of return equation: And then we can put this back into our expected profit equation: In the last step I rearranged the equation into a familiar standard form – it’s a quadratic equation, well in this case a quadratic function: If we were to plot a graph of this function, we’d know it would be a ‘hill’ type parabola because the ‘a’ term is negative in our function (–0.005). We can work out the turning point coordinates: Now, this by itself is enough to tell us the answer – because this is a ‘hill’ type parabola, this turning point is the highest point on the graph and therefore represents the maximum profit point. The ‘300’ represents the optimum production cost – $300. The ‘50’ represents the maximum expected profit per monitor – $50. I’m going to plot a graph as well just to show how the profit changes depending on how much is spent on production. I’ve got the turning point already, and I know it’s a ‘hill’ type graph; I just need to work out the horizontal axis intercepts. I can do this by setting the value of the expected profit function to 0: Now I can use the quadratic equation formula to find what values of ‘cost’ make this equation true: Now we can plot the graph:
The turning point is the maximum expected profit point, which according to the graph and our turning point coordinates, happens when the production cost of each monitor is $300. The expected profit at this point can also be grabbed straight from the turning point – $50 expected profit per monitor. Remember this expected profit takes into account the chance of the monitor being returned for being faulty. It is the average profit per monitor that Bob will earn – often he’ll earn $100 per monitor, but sometimes he’ll lose $300 on a monitor if it is faulty and is returned. |