It’s important to be able to quickly plot a straight line graph in an exam, because you might have to do a whole lot of them in a small amount of time! Luckily, straight line graphs are easy – you only need to know the position of two different points. Then, because it’s a straight line graph, you just draw a straight line through them! Obviously it’s good to have a ruler to help you do this.
It’s important to pick two suitable points to work with as the basis of your graph. Generally speaking, it’s best to pick two points that aren’t too close together. If they are close together, it makes it harder for you to draw your straight line at exactly the right angle:
Sponsored Links

You’re much better off picking points that are further apart, that way the straight line you draw is going to be more accurate.
One way to go is to pick the two intercept points as the two points you plot, before you draw your straight line. This means that you get two things done at the same time – you calculate two points you can plot your graph with but you also work out the x- and y-axis intercepts. One situation where this won’t work though is a relation like this:
![]()
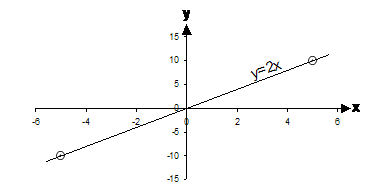
Why not? Well, if you calculate the intercepts, you realise that both the x-axis and the y-axis intercepts are at 0 – the line passes through the origin of the graph (the origin is the point at (0, 0) on a graph). In this case, you’re best off picking two other points apart from the intercepts to use in drawing your graph. I would work out the points for something like x = –5 and x = +5:
x = –5:

x = 5:

This gives us two points we can plot and then draw a straight line through. Some people like to write the relation on the line. This is a good idea, especially if you have more than one relation shown on the same graph. So here’s the final graph: