Straight line graphs can be used to describe how a lot of things behave in real life. For instance, something as simple as buying vegetables from a shop – usually the price is given in dollars per kilogram bought. In mathematical terms, you could say that the price is ‘y’, and that the number of kilos that you buy is ‘x’. Then, you could write a mathematical relation relating the cost to how many kilos you buy. Say for instance you were buying carrots at $2.50 a kilogram:
![]()
Sponsored Links
where x is the number of kilograms you by, and y is the total cost in dollars.
The graph of this relation would look something like this:
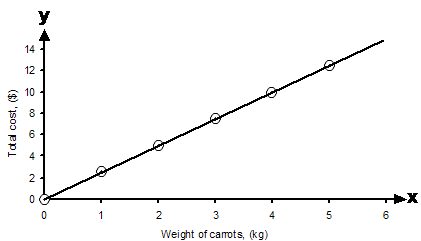
A graph like this could be used to quickly estimate how much a certain weight of carrots would cost, by looking it up on the graph.
Questions about springs – those stretchy things – are very common when you’re doing straight line graphs. We’ll do a typical spring question to show all the various ways you can be asked about them:
|
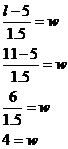
In a science experiment, a spring was hung from a hook in the ceiling. A number of different weights were attached to the spring to make it stretch, and the total length of the spring was measured each time. Here is the table of the results:
(a) Draw a graph showing the results. (b) If I want the spring to stretch to 11 cm long, how much weight should I put on? (c) How long will the spring be when I put 7 kilograms of weight on it? (d) When there’s no weight on the spring, how long is it? (e) Work out the equation relating the length of the spring to the weight on it. |
||||||||||
|
Solution |
||||||||||
|
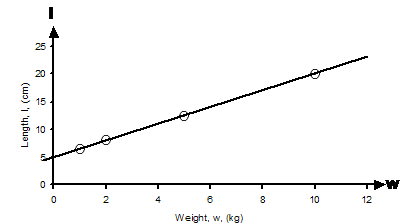
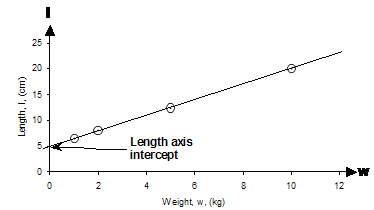
(a) Draw a graph showing the results. Ok, first of all we need to draw a graph. This part’s not too hard – just need to put some points down on a graph. We don’t even have to calculate the points either – they’re already in the table. What we can do though is come up with some symbols to represent the ‘weight’ and ‘length’ variables. How about ‘w’ for ‘weight’, and ‘l’ for ‘length’? Now which axis is going to represent each variable? Well, the length of the spring depends on how much weight we put on the spring. In general, the dependent variable is plotted as the range, which are y values on the graph. So on our graph the length of the spring will be plotted as y values. This means the weights will be plotted as the domain, which means they’ll be x values. So our graph will look like this:
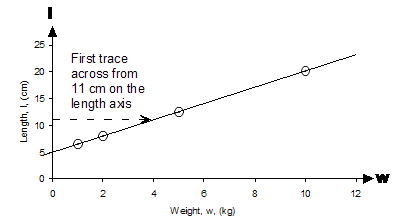
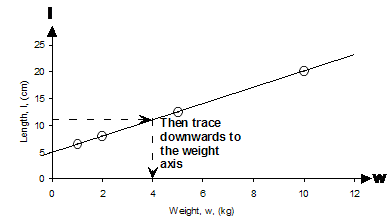
Notice how a straight line fits quite nicely through all the data points. Also look how instead of the normal ‘x’ and ‘y’ labels at the ends of the axes, I’ve put ‘w’ and ‘l’ instead. Now on to part (b): (b) If I want the spring to stretch to 11 cm long, how much weight should I put on? Well, we can use our graph to work this out quite quickly. What we need to do is find the point on the line which corresponds to a length of 11 cm. We can do this by tracing a horizontal line from 11 cm on the length axis across to the right until it intersects our plotted line. Then, to find the weight, we just trace a vertical line from this point down to the weight axis:
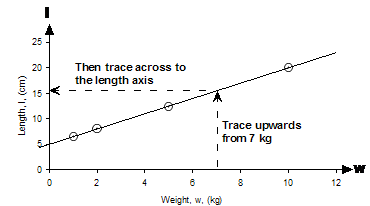
So the weight we find on the weight axis is 4 kg. This is the answer to part (b). (c) How long will the spring be when I put 7 kilograms of weight on it? This is the same sort of question as part (b), except this time we start at 7 kilograms on the weight axis, trace upwards and the sideways across to the length axis, like this:
Now if you’re expected to get a very accurate answer in an exam then usually you’ll get given graph paper so you can draw a really big, really accurate graph. However, if you’re just drawing on normal paper it’s hard to get an exact answer. You have to make as good an estimate as possible. In this case, the point where I’ve traced across to on the length axis is just a tiny bit above 15 cm, so I’m gonna guess it is about 15.5 cm. (d) When there’s no weight on the spring, how long is it? This one’s easy – when there’s no weight on the spring, what does our ‘w’ variable equal? Simple – it equals zero. The length axis crosses through our weight axis at w = 0. So we can find the length of the spring when there is no weight on it by simply looking at the intercept of our line with the length axis, because this is where w = 0.
The intercept on the length axis seems to be around the 5 cm mark, so the length of the spring with no weight on it is 5 cm. (e) Work out the equation relating the length of the spring to the weight on it. This is the trickiest bit of the question. We have to come up with an equation which describes the line in the graph. How are we gonna do this? Well, first up, it’s a straight line, so this gives us some clues to what the equation’s gonna look like. We’ve come across lots of straight line equations, usually they look something like this: Something involving y = something involving x For instance, Something involving l = something involving w The general form of these equations is more specifically: We just have to work out what the values of ‘A’ and ‘B’ are. Now one thing we know is that when the weight is 0 kg, then the spring’s length is 5 cm. If we put these values into the general form of our equation, we can work out what B is: Now anything multiplied by zero gives you zero, so that gets rid of ‘A’: Bingo – we’ve worked out what B is. But we still need to work out what A is. We solved what B was by picking a particular point on the graph and putting the values of that point into the equation. How about we pick another point and do the same again to try and work out what A is? We’re given another point in the table – for a weight of 1 kg the spring is 6.5 cm long. We can put these values into our equation, as well as the value of B which we now know, like this: So we’ve now worked out what A is as well. This means we’ve found the equation which describes our line, it is: Now the great thing about having an equation is we can check that our answers are consistent with each other. We can do this by using it to check our answers to parts (b) and (c). (b) again: If I want the spring to stretch to 11 cm long, how much weight should I put on? We’re trying to work out what weight to put on the spring, or a value of w in other words. This means we should rearrange the equation so that it is in the form w = … Now all we need to is substitute in the value of l that we want – 11 cm: So w is 4 kg, which agrees with what we got earlier by reading off the graph. (c) again: How long will the spring be when I put 7 kilograms of weight on it? All we need to do is substitute 7 kg for w in the original equation: So the spring will be 15.5 cm long, which also agrees with the answer we got earlier by reading off the graph. By checking that we get the same answers using our equation as we do reading off the graph, we have shown that our answers and equation are consistent with each other, which is always a good thing. |